Miraloma Park is a residential retreat with San Francisco's energy all around it, bordered by seven neighboring districts that put a wide range of activities within easy reach in every direction.
Its two biggest neighbors, Glen Park and Diamond Heights, sit to the east, while Mount Davidson takes up a large pocket of space within its own borders. Homes here climb curving streets, often built right into the hillside, giving them some of the most striking views in San Francisco. Despite the bustle of its surrounding neighborhoods and major roads, Miraloma Park stays notably calm, with a residential feel running through it all.
Beyond its generous green space, Miraloma Park sits close to commercial hubs and transit lines. There's a modest cluster of shopping and dining right along its borders, though most residents head a bit further out for bigger errands and dining options. Its proximity to two BART stations makes getting around the city simple.
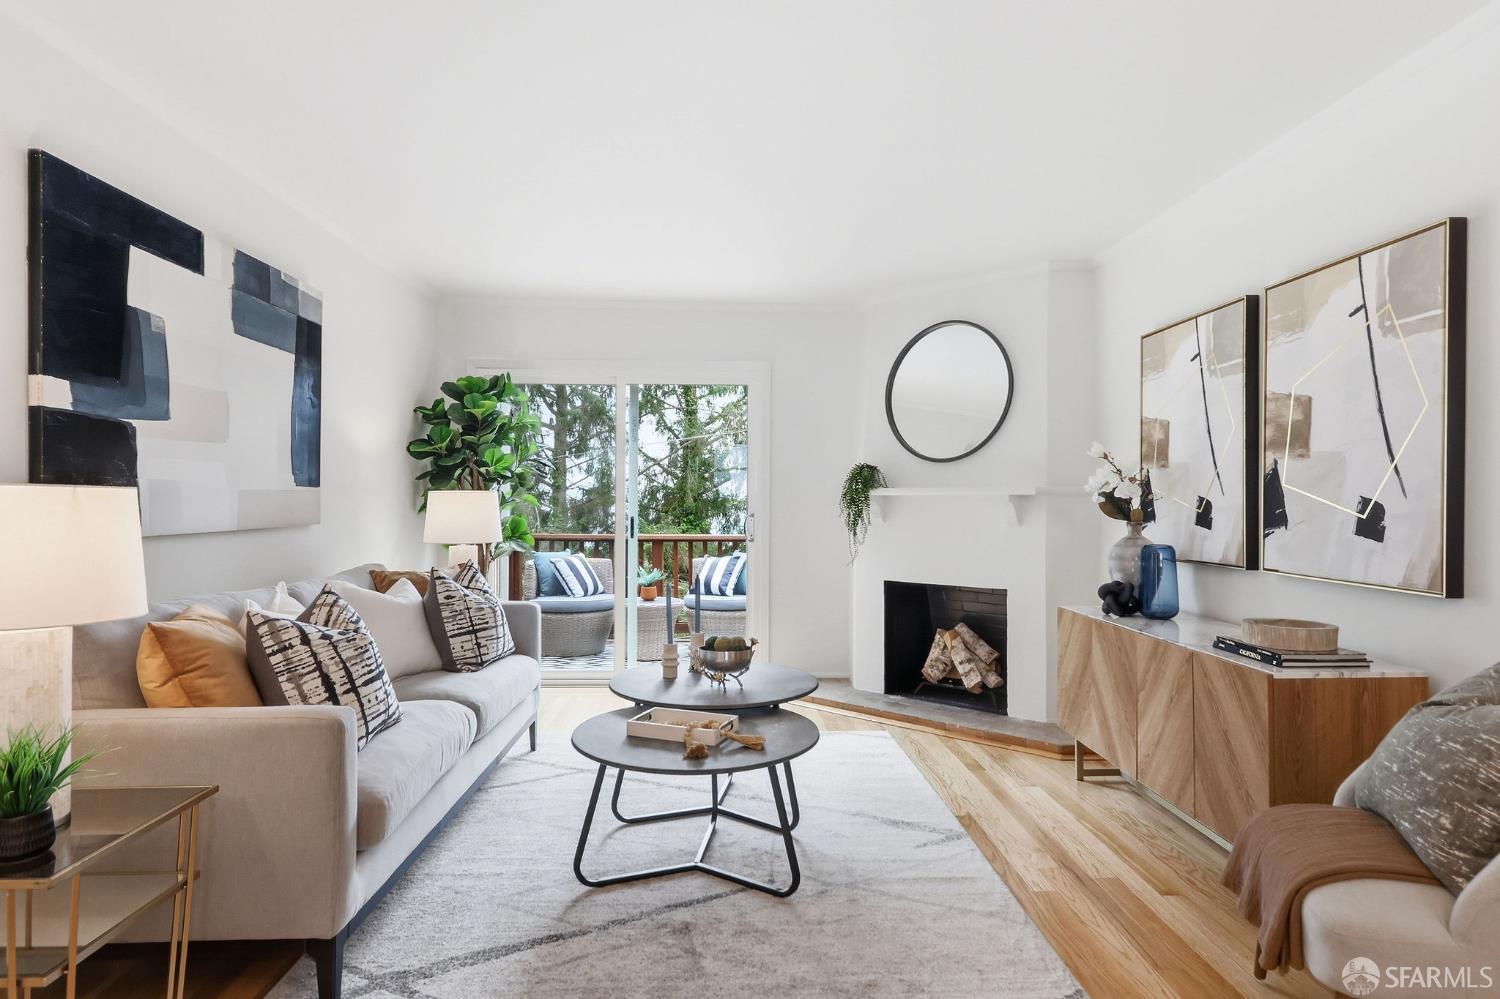
Homes here vary widely, a reflection of development that started in the 1920s and continued for decades. Residents will find everything from classic row houses to Mid-Century Modern and sleek contemporary builds.
With its mix of green space, varied architecture, and easy city access, Miraloma Park remains a neighborhood deeply tied to the San Francisco way of life.
4,714 people live in Miraloma Park, where the median age is 47 and the average individual income is $127,964. Data provided by the U.S. Census Bureau.
Total Population
Median Age
Population Density Population Density This is the number of people per square mile in a neighborhood.
Average individual Income
Miraloma Park has 1,998 households, with an average household size of 2. Data provided by the U.S. Census Bureau. Here’s what the people living in Miraloma Park do for work — and how long it takes them to get there. Data provided by the U.S. Census Bureau. 4,714 people call Miraloma Park home. The population density is 30,823 and the largest age group is Data provided by the U.S. Census Bureau.
Total Population
Population Density Population Density This is the number of people per square mile in a neighborhood.
Median Age
Men vs Women
Population by Age Group
0-9 Years
10-17 Years
18-24 Years
25-64 Years
65-74 Years
75+ Years
Education Level
Total Households
Average Household Size
Average individual Income
Households with Children
With Children:
Without Children:
Marital Status
Blue vs White Collar Workers
Blue Collar:
White Collar:
Other Communities
Browse things to do, places to see, and nearby landmarks to explore.
With deep roots across Northern California and the backing of a global powerhouse, our team delivers tailored service with unmatched insight.