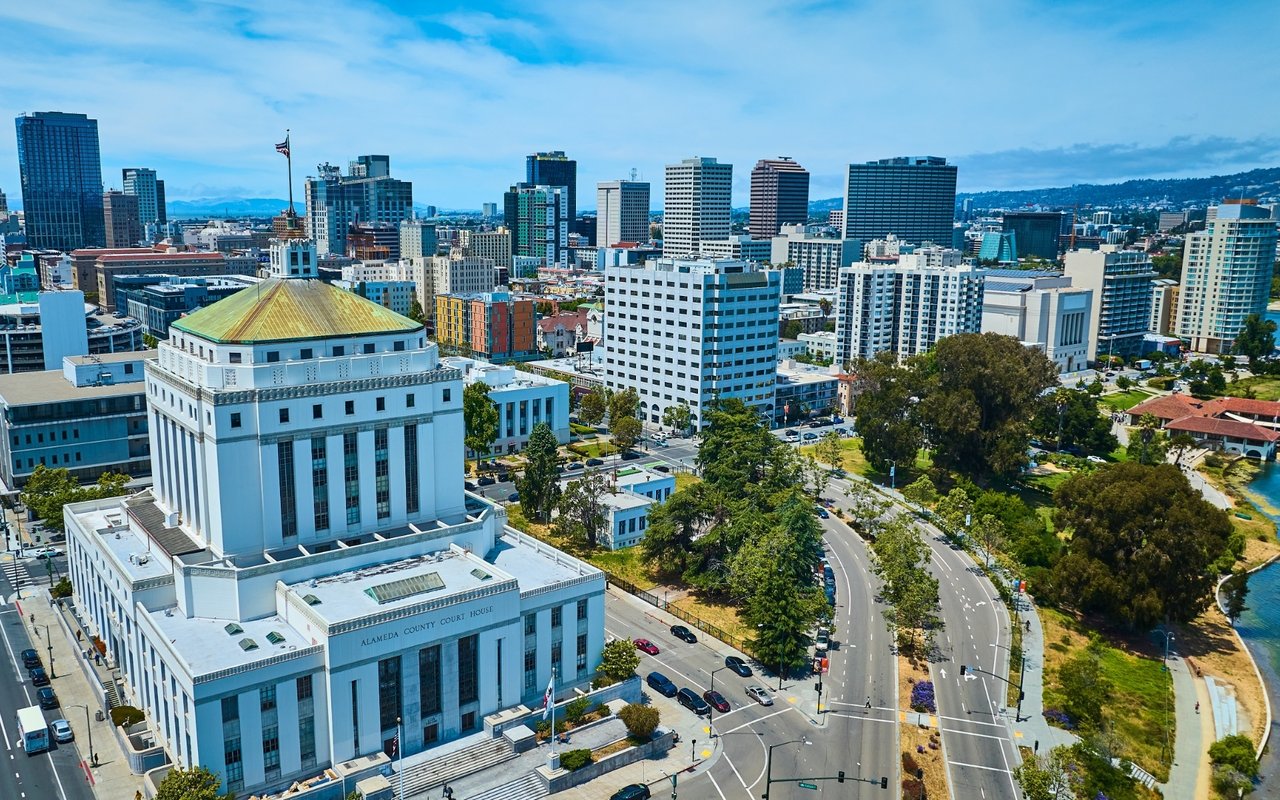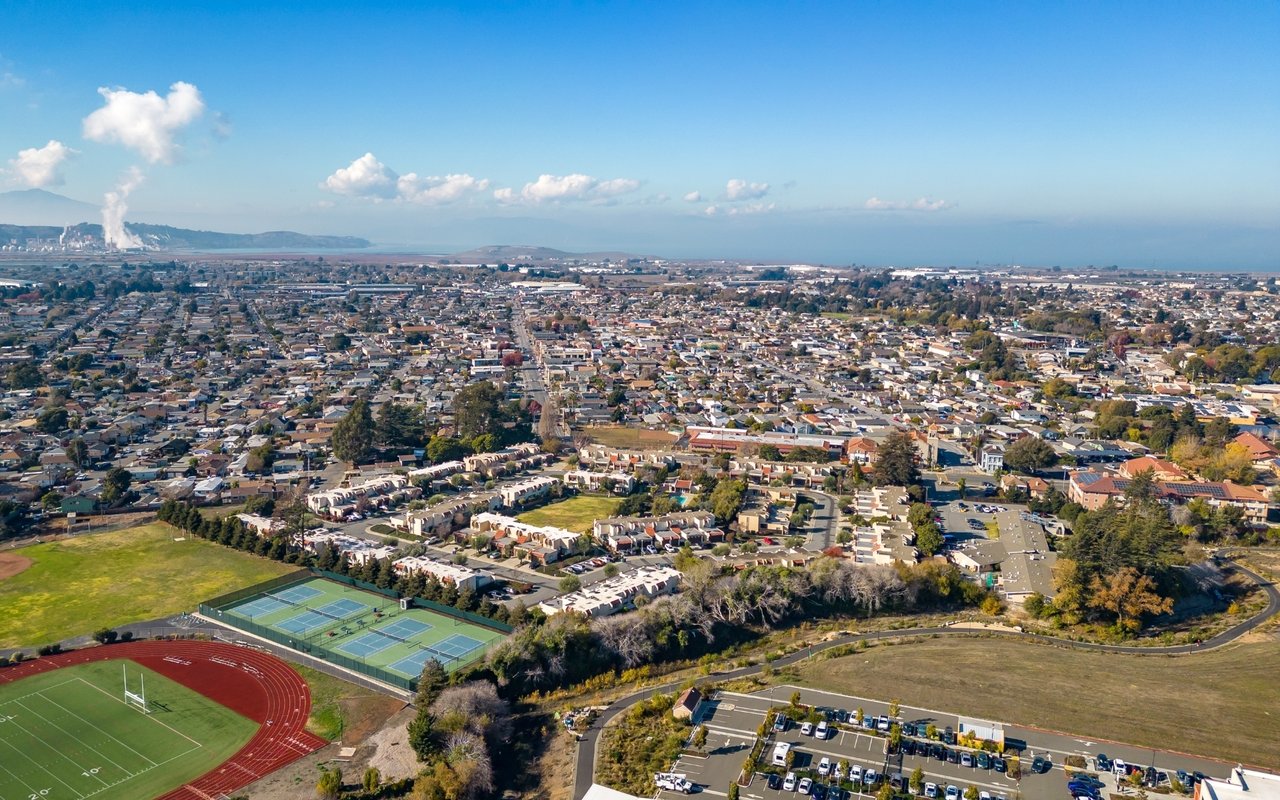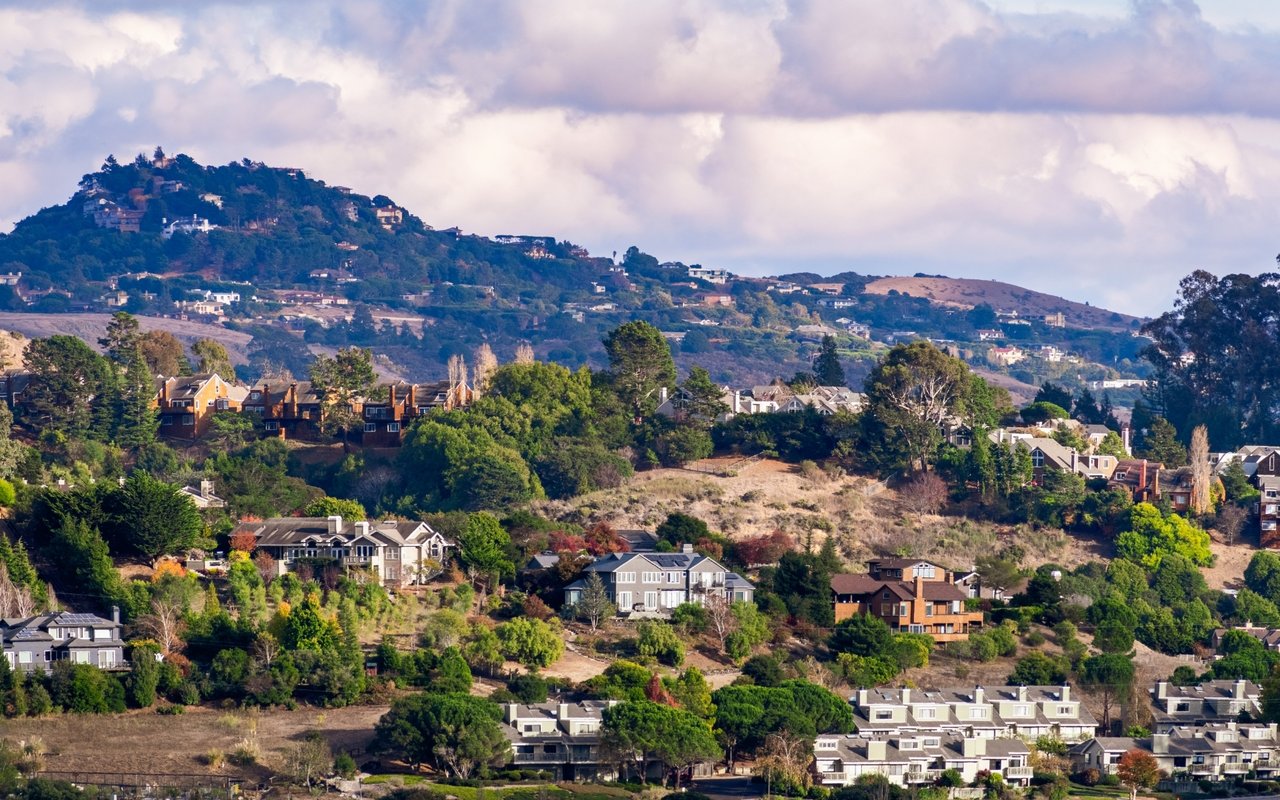
Lakeside offers a quiet, residential retreat from the bustle of the city. This narrow strip of homes and small pockets of shared green space sits close to everything San Francisco has to offer.
Built between the late 1930s and 1950, Lakeside embraced underground utilities early on, giving the neighborhood a cleaner, more polished look than many of its peers. Most homes here are modest in scale, though a good number of larger, stately homes are mixed in too.
White picket fences remain the norm in this well-kept neighborhood, lending it an old-fashioned charm that residents work hard to preserve — a distinct contrast to the bigger-city feel of the neighborhoods around it.
Its western border runs along both San Francisco State University and the Stonestown Galleria shopping center. This stretch of 19th Avenue is packed with shopping, dining, entertainment, and transit options of every kind. The Muni light rail stop here offers quick access to every corner of the city and stays busy with a steady mix of neighbors, students, and shoppers headed to Stonestown.
Its well-placed but low-key location lets residents enjoy a suburban pace of life while keeping the bigger city's amenities within easy reach whenever they want them.
1,228 people live in Lakeside, where the median age is 54 and the average individual income is $110,238. Data provided by the U.S. Census Bureau.
Total Population
Median Age
Population Density Population Density This is the number of people per square mile in a neighborhood.
Average individual Income
Lakeside has 458 households, with an average household size of 3. Data provided by the U.S. Census Bureau. Here’s what the people living in Lakeside do for work — and how long it takes them to get there. Data provided by the U.S. Census Bureau. 1,228 people call Lakeside home. The population density is 6,765 and the largest age group is Data provided by the U.S. Census Bureau.
Total Population
Population Density Population Density This is the number of people per square mile in a neighborhood.
Median Age
Men vs Women
Population by Age Group
0-9 Years
10-17 Years
18-24 Years
25-64 Years
65-74 Years
75+ Years
Education Level
Total Households
Average Household Size
Average individual Income
Households with Children
With Children:
Without Children:
Marital Status
Blue vs White Collar Workers
Blue Collar:
White Collar:
Other Communities
Browse things to do, places to see, and nearby landmarks to explore.
With deep roots across Northern California and the backing of a global powerhouse, our team delivers tailored service with unmatched insight.