Ingleside sits in San Francisco's southwestern corner. Like its neighbors, the land was once home to horse racing, roadhouses, and farms. After the 1906 earthquake, it grew into a quiet residential pocket that still draws homebuyers today.
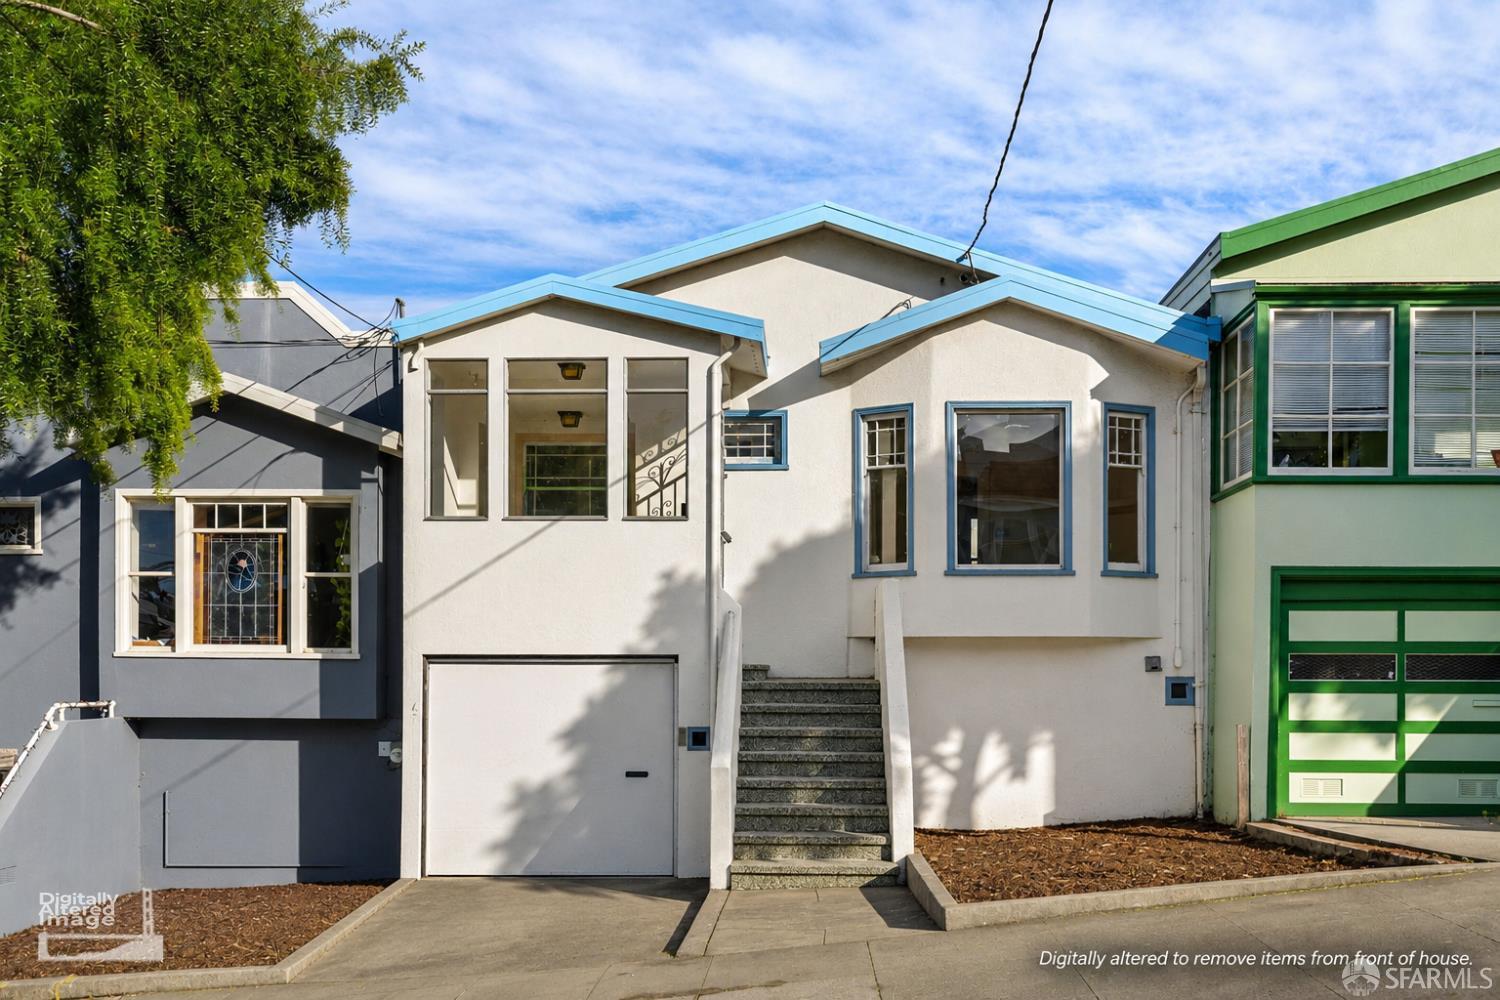
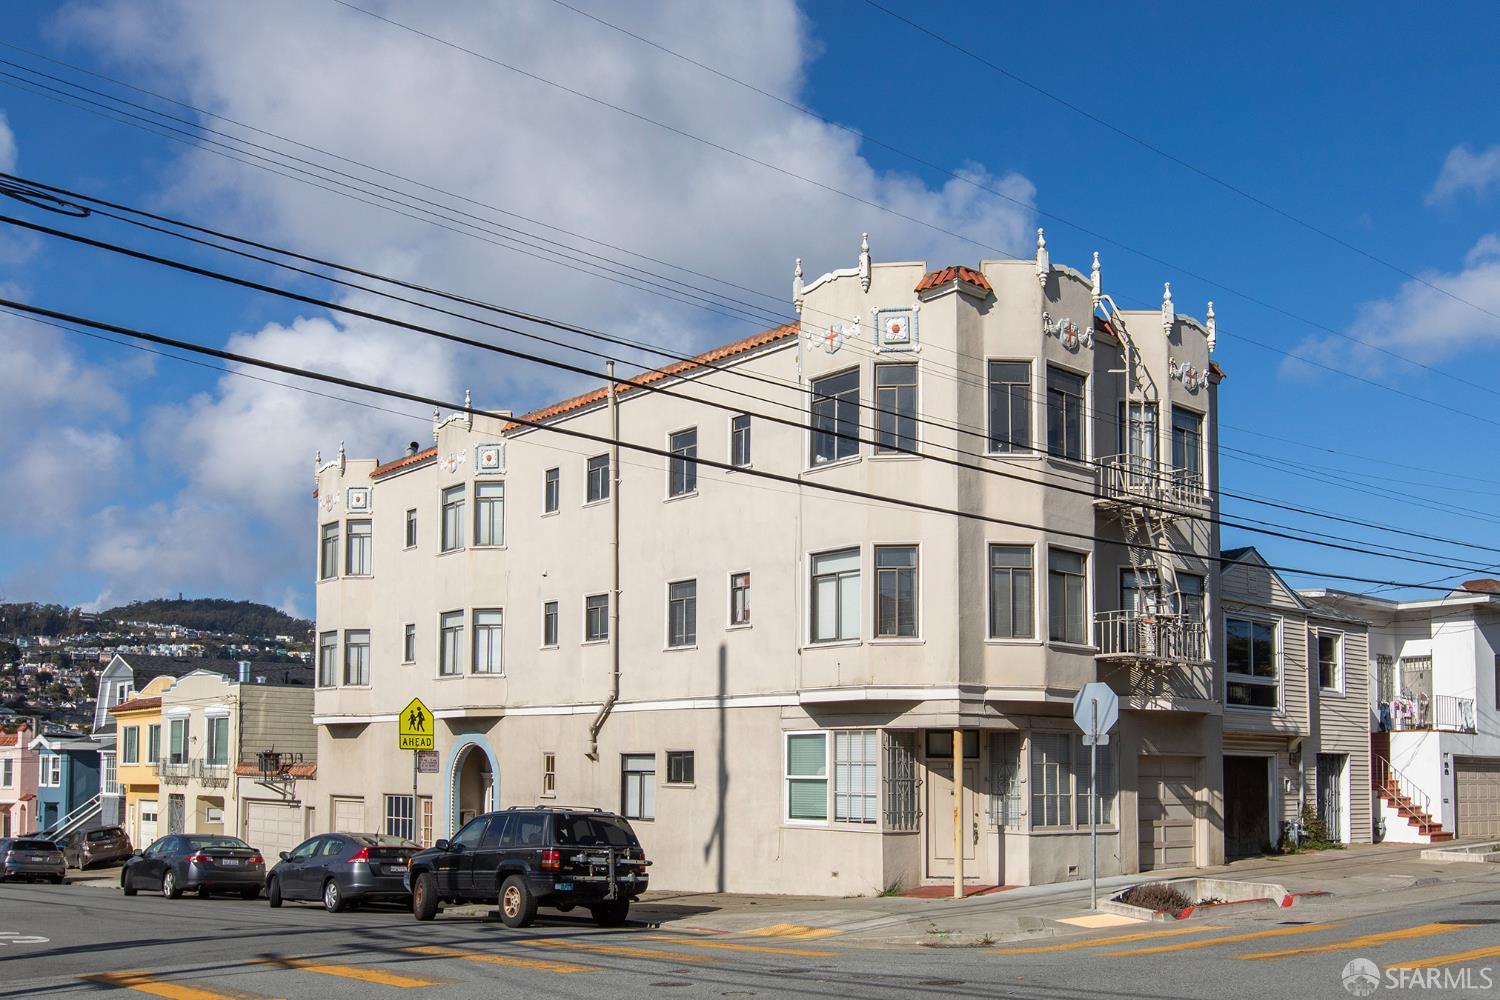
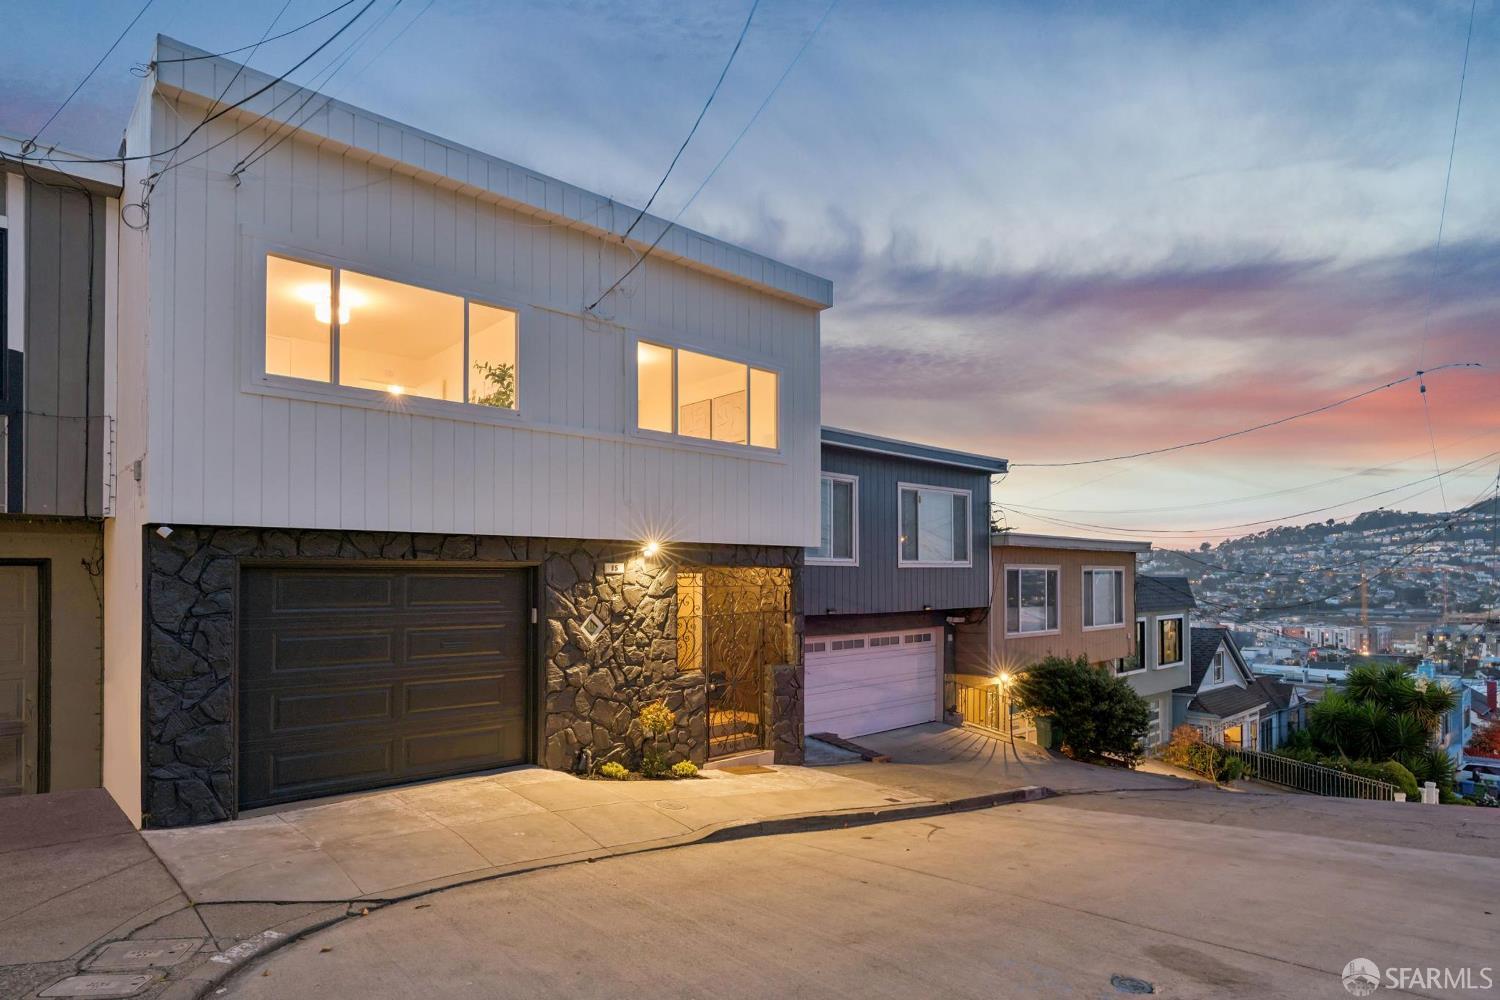
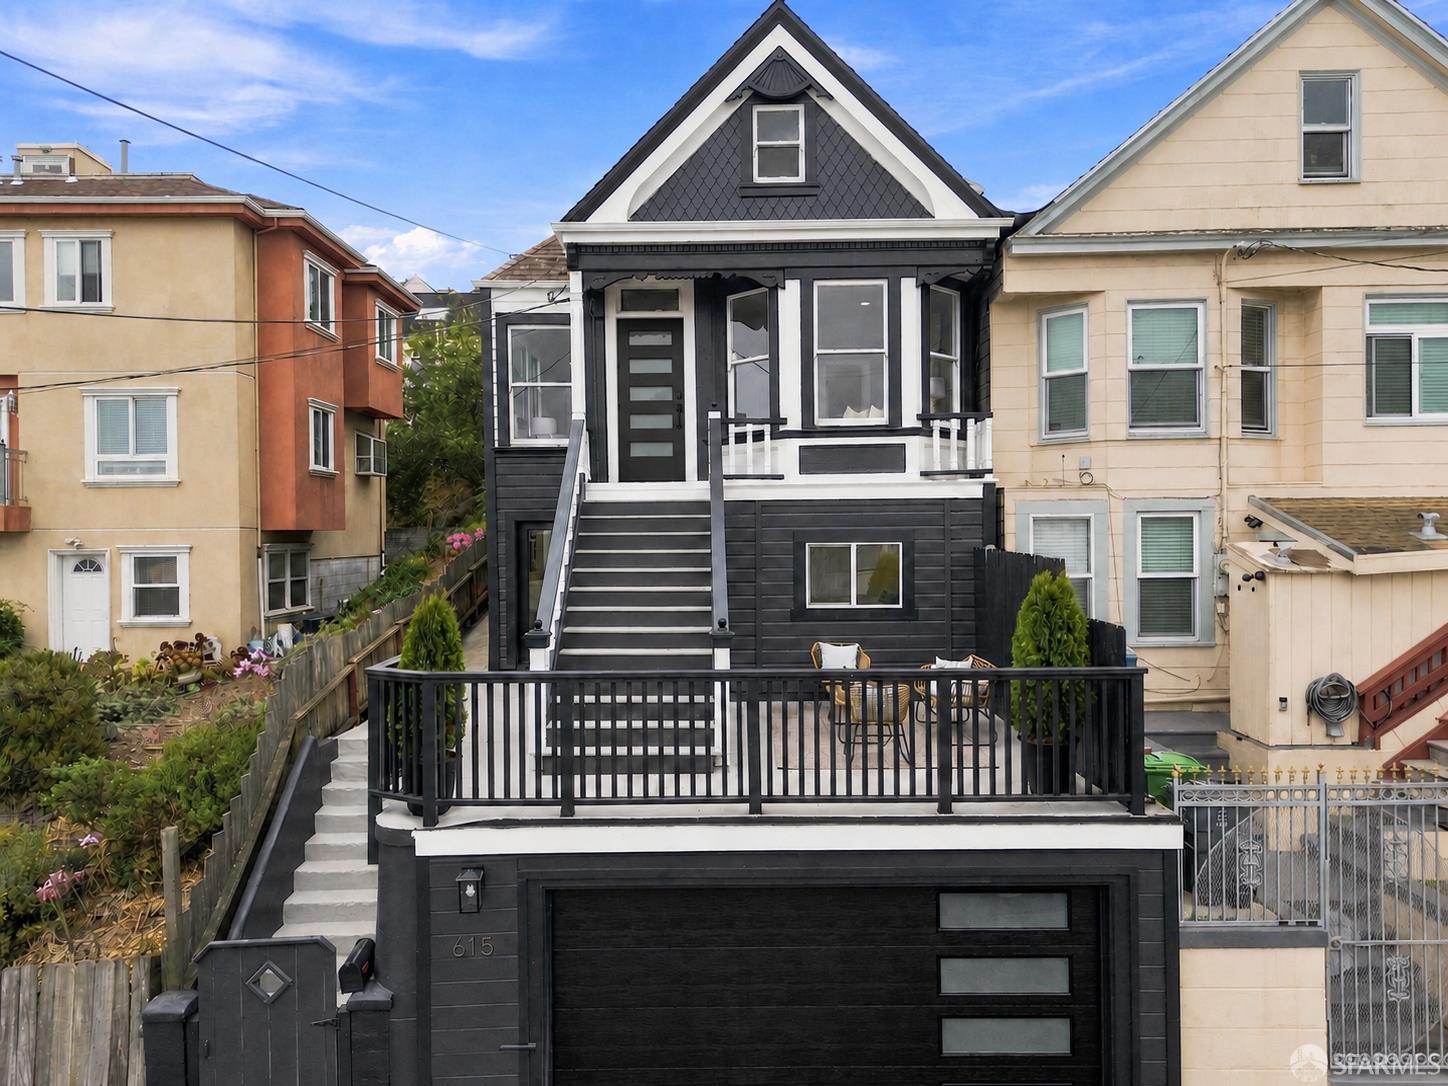
Most homes here were built before 1940, and most are small to medium single-family houses in a range of styles: quaint Victorian cottages, Mediterranean Revival homes, stucco-clad townhouses, and Spanish-style residences.
Ocean Avenue runs along Ingleside's entire northern edge and serves as the main commercial strip. What residents can't find here is easy to find in neighboring districts, and public transit links Ingleside to the rest of the city.
Notable stops along Ocean Avenue include the Ingleside Community Center, which offers after-school tutoring and a place for kids to study, and the Ingleside Branch Library, a striking, light-filled building that opened in 2009. There's also a longtime favorite watering hole, The Ave Bar, a neighborhood fixture since 1949 and a city-recognized Legacy Business.
Ingleside is considered one of San Francisco's more affordable residential neighborhoods. Its location puts the whole city within easy reach, and its growing popularity makes it an appealing choice for both buyers and renters.
9,045 people live in Ingleside, where the median age is 41 and the average individual income is $53,100. Data provided by the U.S. Census Bureau.
Total Population
Median Age
Population Density Population Density This is the number of people per square mile in a neighborhood.
Average individual Income
Ingleside has 2,588 households, with an average household size of 3. Data provided by the U.S. Census Bureau. Here’s what the people living in Ingleside do for work — and how long it takes them to get there. Data provided by the U.S. Census Bureau. 9,045 people call Ingleside home. The population density is 27,342 and the largest age group is Data provided by the U.S. Census Bureau.
Total Population
Population Density Population Density This is the number of people per square mile in a neighborhood.
Median Age
Men vs Women
Population by Age Group
0-9 Years
10-17 Years
18-24 Years
25-64 Years
65-74 Years
75+ Years
Education Level
Total Households
Average Household Size
Average individual Income
Households with Children
With Children:
Without Children:
Marital Status
Blue vs White Collar Workers
Blue Collar:
White Collar:
Other Communities
Browse things to do, places to see, and nearby landmarks to explore.
With deep roots across Northern California and the backing of a global powerhouse, our team delivers tailored service with unmatched insight.