Glen Park is one of San Francisco's most well-balanced neighborhoods, offering just enough of everything to satisfy a city dweller craving a bit of suburban calm.
With the city's transit lines running throughout the neighborhood, including its own BART station, residents can reach nearly any corner of the city in short order.
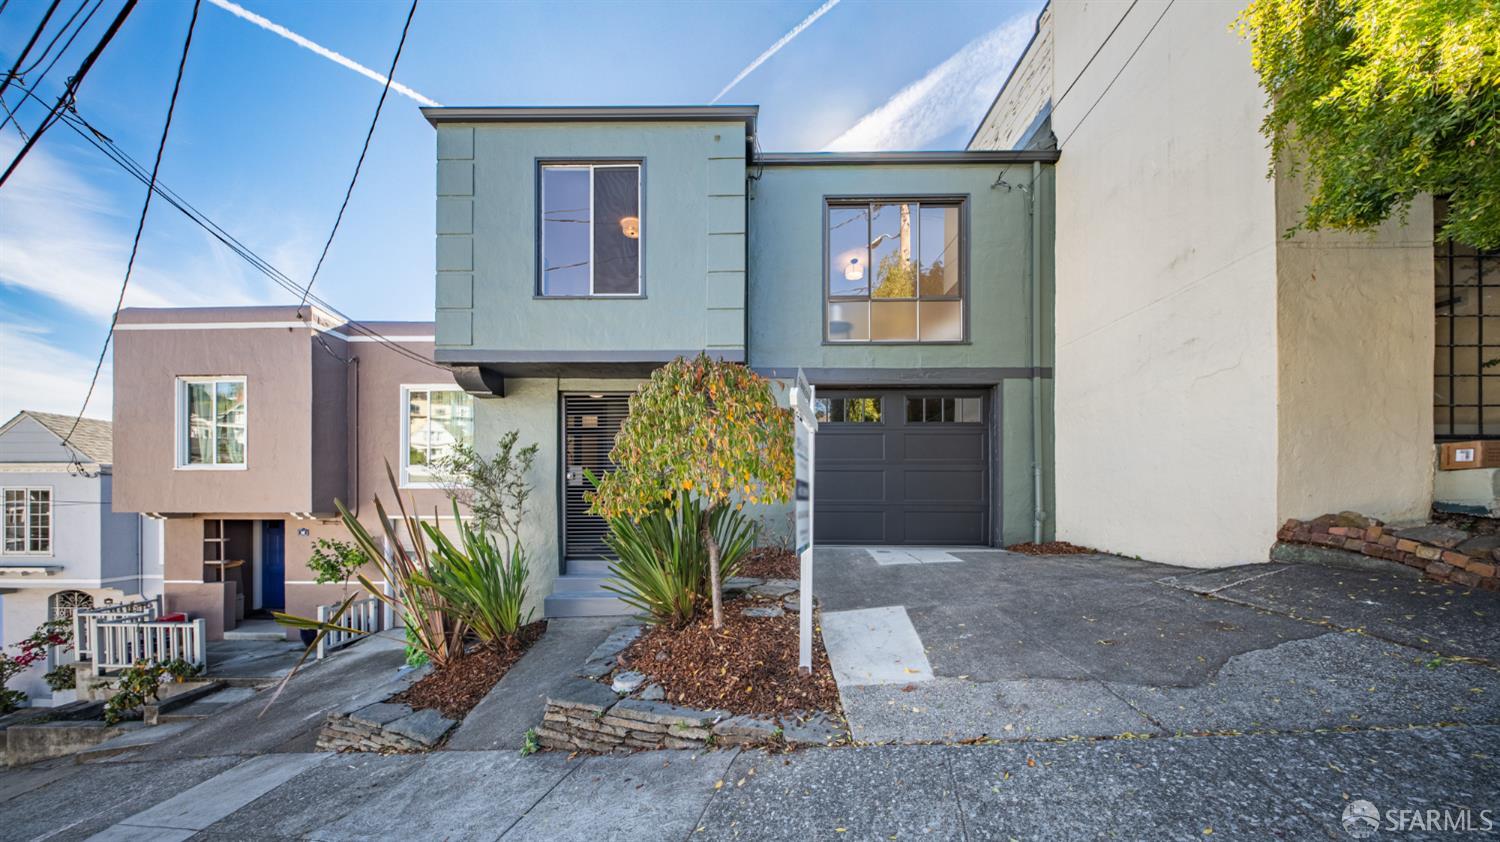
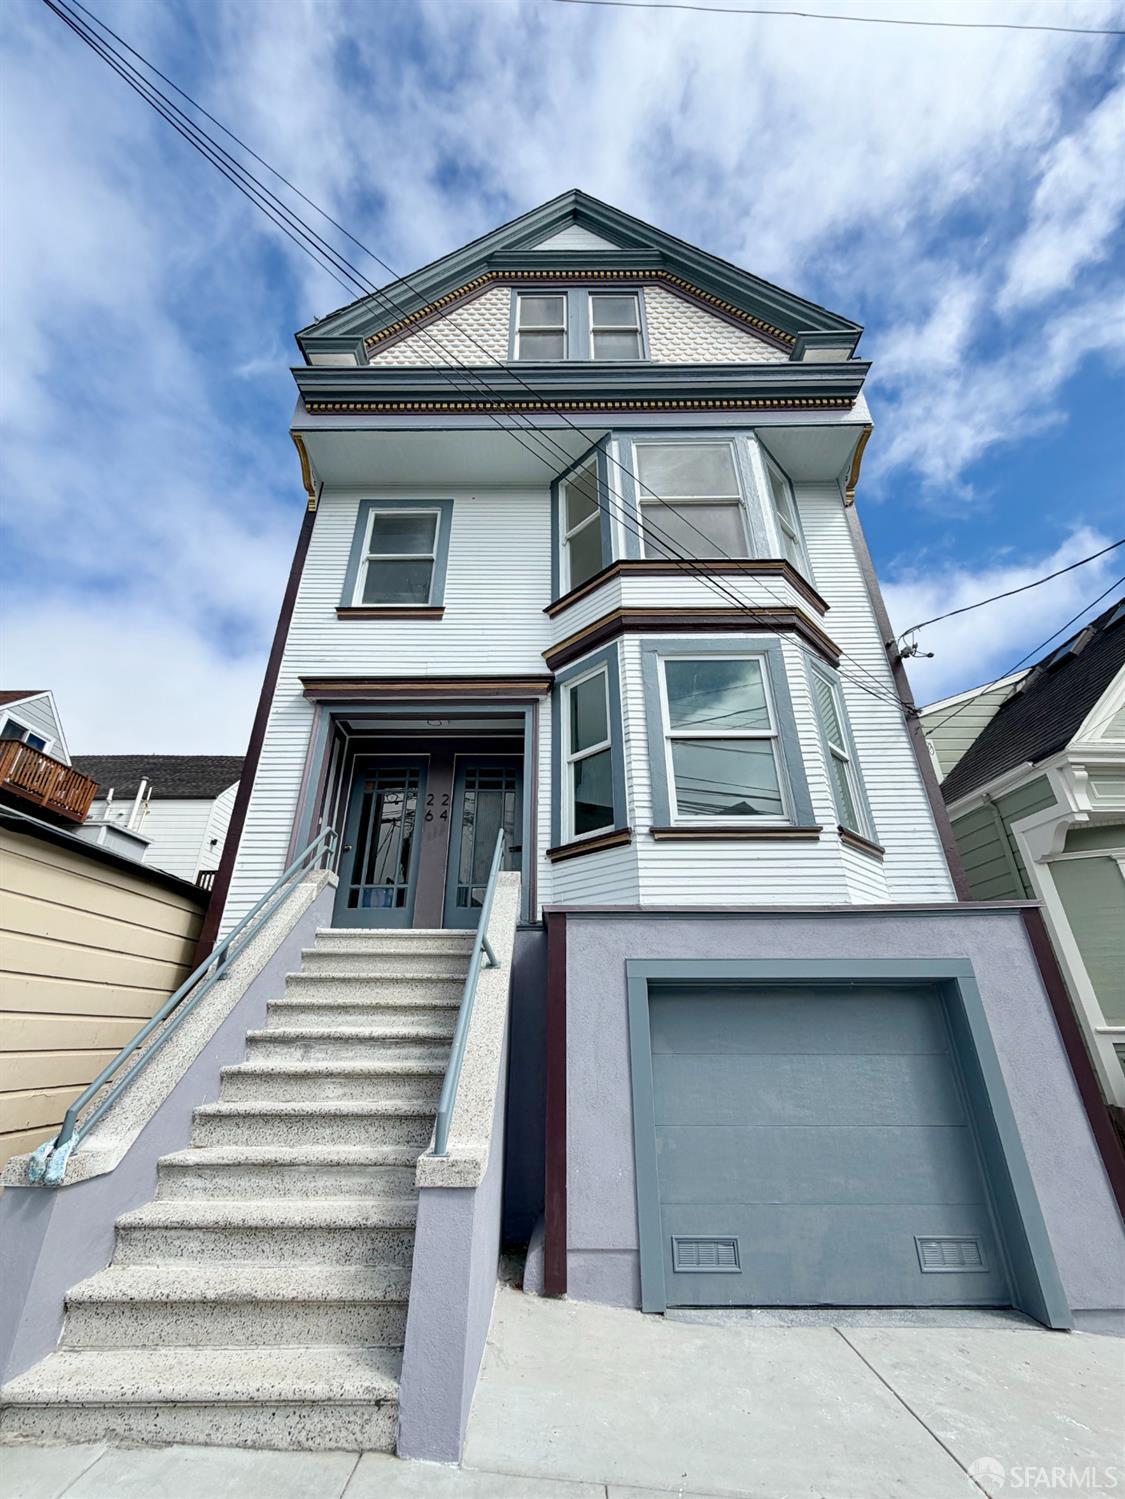
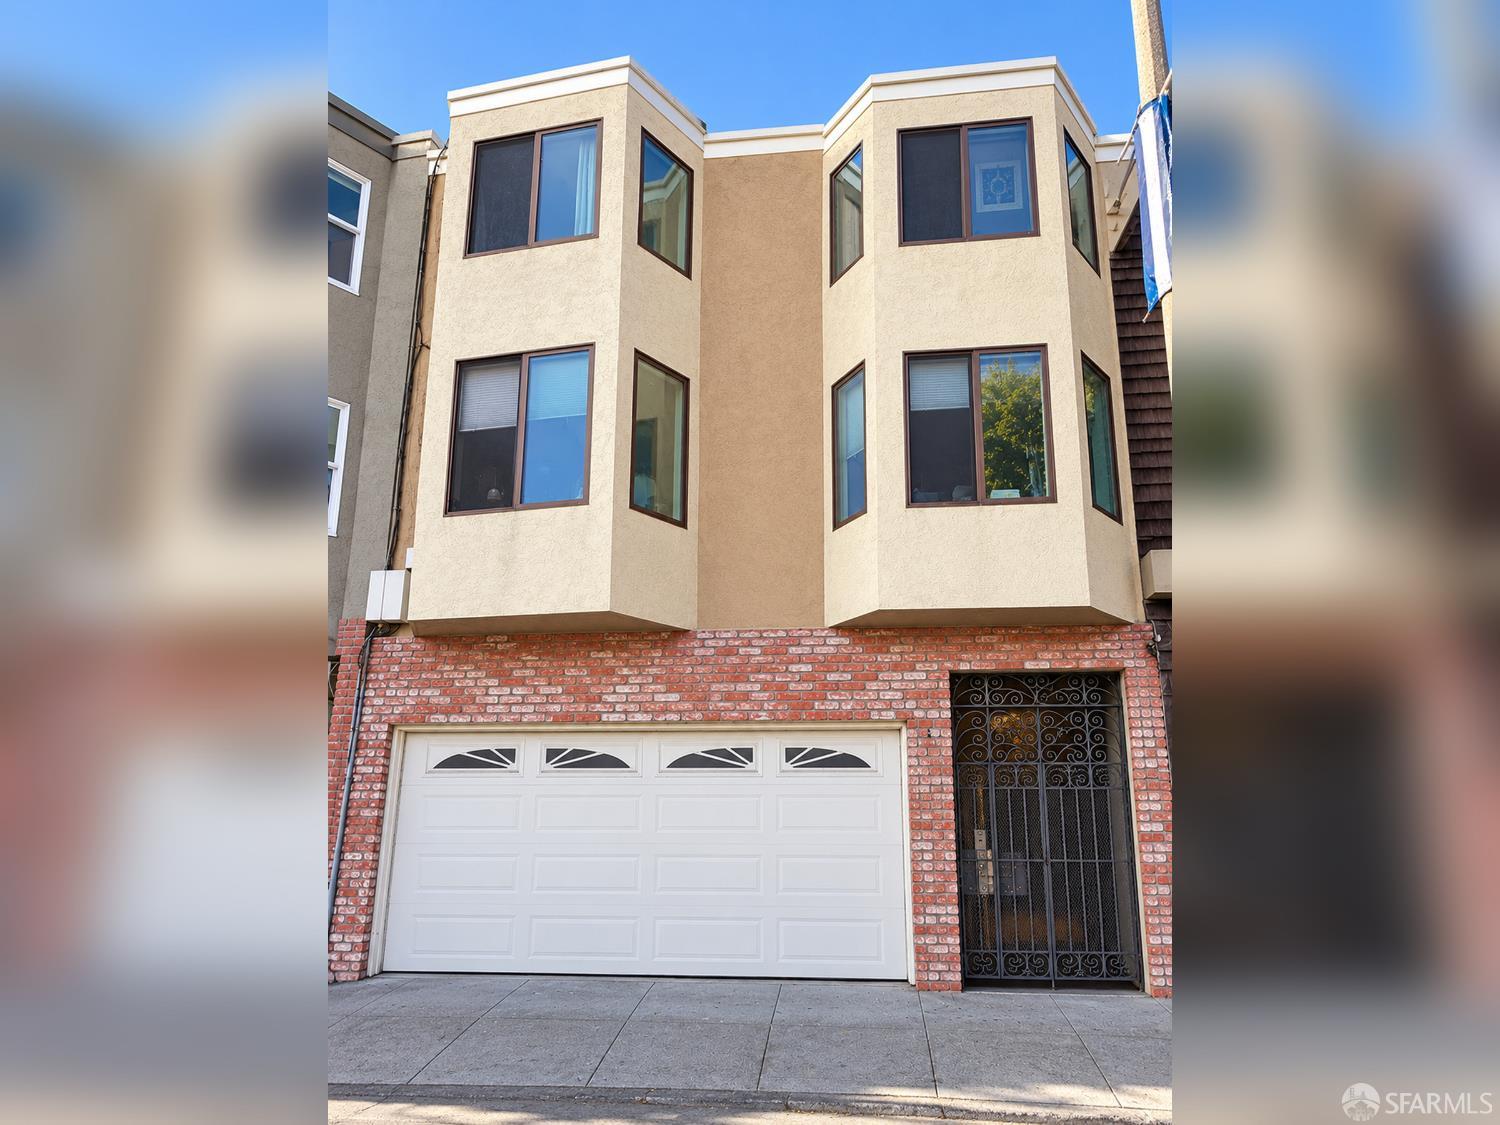
Most of Glen Park's homes predate the 1920s, part of a development wave that began in the late 19th century. Bungalow-style walk-ups climb the hillsides, while newer homes at the highest points make the most of the views with large panoramic windows.
On the neighborhood's western edge, part of the sprawling Glen Canyon Park offers a big shared green space, while the rolling residential streets lead down into the village at the intersection of Chenery and Diamond streets. Known for its distinctive mom-and-pop businesses, the village is full of coffee shops, organic markets, and independent boutiques. Neighboring Noe Valley to the north and Bernal Heights to the east round things out with even more everyday essentials.
Glen Park may be a quiet residential pocket, but its charm makes it a classic San Francisco experience — one with a genuine village feel at its core.
9,743 people live in Glen Park, where the median age is 40 and the average individual income is $117,136. Data provided by the U.S. Census Bureau.
Total Population
Median Age
Population Density Population Density This is the number of people per square mile in a neighborhood.
Average individual Income
Glen Park has 3,804 households, with an average household size of 3. Data provided by the U.S. Census Bureau. Here’s what the people living in Glen Park do for work — and how long it takes them to get there. Data provided by the U.S. Census Bureau. 9,743 people call Glen Park home. The population density is 28,236 and the largest age group is Data provided by the U.S. Census Bureau.
Total Population
Population Density Population Density This is the number of people per square mile in a neighborhood.
Median Age
Men vs Women
Population by Age Group
0-9 Years
10-17 Years
18-24 Years
25-64 Years
65-74 Years
75+ Years
Education Level
Total Households
Average Household Size
Average individual Income
Households with Children
With Children:
Without Children:
Marital Status
Blue vs White Collar Workers
Blue Collar:
White Collar:
Other Communities
Browse things to do, places to see, and nearby landmarks to explore.
With deep roots across Northern California and the backing of a global powerhouse, our team delivers tailored service with unmatched insight.